Symbol Master, Exchange Data International, and CPZ Partner to Streamline Data for AI Trading

EDI’s global reference and pricing data and SMI’s options symbology are being integrated into CPZAI, the AI-native systematic trading operating system built by CPZ

London, United Kingdom //New York, United States of America // September 09, 2026 – Exchange Data International (EDI), Symbol Master (SMI), and CPZ today announced a strategic partnership that integrates trusted financial data into CPZAI, CPZ’s AI-native systematic trading operating system.

Under the partnership, EDI’s global equity reference data and end-of-day pricing, and SMI’s core options reference content and analytics will both be integrated into CPZAI’s platform. This eliminates the need for traders to manually move data between tools, a process that introduces delays and errors.

The partnership delivers institutional-grade data integrity directly into the research and trading process, eliminating delays and reducing risk across the entire investment pipeline.

Learn more about CPZAI and schedule a demo at https://ai.cpz-lab.com or via info@exchange-data.com.

Jonathan Bloch, CEO at EDI

Jonathan Bloch, CEO of Exchange Data International, said: “We welcome CPZ’s entry into the data distribution market. Competition is important to ensuring a diverse, innovative and high-quality data distribution landscape.”

George Tull, CEO of Symbol Master Inc

George Tull, CEO of Symbol Master Inc, said: “SMI is pleased to announce its integration with CPZ, expanding SMI’s data quality offering into the CPZ ecosystem and the systematic trading community.”

Chris Preuss, Founder and CEO of CPZ

Chris Preuss, Founder and CEO of CPZ, added: “CPZAI is the AI-native systematic trading operating system: the production layer between a firm’s models and the market. It is only as strong as the data underneath it. Bringing EDI’s trusted reference and pricing data and SMI’s options symbology directly into the platform gives our users institutional-grade data integrity from first backtest to live execution.”

About Exchange Data International

Exchange Data International (EDI) is a leading provider of global securities data, delivering high-quality, comprehensive market data to financial institutions worldwide. Specializing in pricing, corporate actions, and reference data, EDI helps clients navigate complex global markets with reliable, timely, and customizable market data.

About Symbol Master Inc. (SMI):

Symbol Master Inc. has been the cornerstone of precision in Standardized Options Symbology for over 50 years, playing a vital role in the global financial community. SMI’s commitment to data integrity and market consistency has established it as a key partner in the financial services industry, offering symbology validation software noted for its accuracy and reliability, catering to the unique needs of Multi-Asset Quantitative Trading Houses and Analytic Trading Firms.

About CPZ

CPZ developed CPZAI, the AI-native systematic trading operating system. CPZAI is the production layer between a firm’s trading models and the market. It deploys strategies, applies risk controls at the strategy and portfolio level, routes orders to connected brokers, and reconciles positions and executions into an auditable record. https://ai.cpz-lab.com/partners

Media Contact

Exchange Data International
Romy Threadgold – Head of Marketing
r.threadgold@exchange-data.com

CPZ
Chris Preuss – Founder and CEO
chris@cpz-lab.com

-END-

Understanding Options Data and Risk Management: A Guide to Data Quality for Risk Professionals

Options data and risk management are inseparable: your risk models are only as reliable as the data running through them. That statement is obvious in theory and routinely ignored in practice, especially in options markets where contracts carry more dimensions than any other instrument class. A single options position involves a strike, an expiration, a put or call designation, an exercise style, a multiplier, an underlying mapping, and an exchange-specific symbology convention. Every one of those attributes has to be correct before a single Greek gets calculated.

Get any of them wrong and your risk numbers are fiction. The quality of your options data is not a back-office concern, it is a risk management problem. Firms with mature risk infrastructure invest in purpose-built validation at the symbology layer before data enters their risk engines. This guide covers the data types that power risk decisions, the core Greeks your portfolio depends on, how to build and use an implied volatility surface for stress testing, and a practical workflow for monitoring an options portfolio.

The Three Types of Volatility: Symbol Master’s Complete Pipeline

Volatility is the engine that powers options pricing and risk management. But not all volatility is created equal, and understanding the different types is foundational to building reliable risk infrastructure.

1. Realized Volatility

Realized volatility is the volatility actually realized in the underlying market, calculated from actual price moves (e.g., daily stock price changes). The most common approach is to calculate realized volatility as the standard deviation of daily logarithmic returns, which is why it’s sometimes called statistical volatility.

A critical distinction: option prices don’t affect realized volatility in any way. You can calculate realized volatility even for securities without any options on them. Conversely, there is no implied volatility without options.

2. Historical Volatility

Historical volatility (HV) is a statistic measuring volatility of an asset’s price in a past period, as opposed to future volatility, which is forward looking, and implied volatility, which is the volatility implied in option prices.

The length of period over which it is measured is a parameter to HV calculation. Popular lengths are:

  • 20 or 21 trading days (one month)
  • 63 trading days (one quarter)
  • 252 trading days (one year)

There are several methods to calculate historical volatility. By far the most common is standard deviation of logarithmic returns.

3. Implied Volatility: Empirical and Theoretical

The implied volatility surface maps volatility across strikes and expiries, feeding pricing engines and vega hedging strategies. Empirical implied volatility draws from actual market trades, but markets are sparse, not every strike trades daily. Additionally, Symbol Master calculates theoretical implied volatility using SSVI for US and FLEX markets and SABR for global markets (EU, APAC, Far East), each calibrated to regional market conditions. This delivers a complete volatility pipeline without requiring dedicated infrastructure.

Symbol Master coverage CTA banner — view full options data coverage across 21 countries

How Implied Volatility Powers Greeks Sensitivity Calculations

The Implied Volatility-to-Greeks Pipeline

All Greek and sensitivity calculations require implied volatility as the foundation. To calculate delta, gamma, theta, vega, and rho, Symbol Master uses implied volatility as the input and derives sensitivity values as the output. This is not a marginal step in the process; it is the critical link between market prices and risk metrics.

Pre-computed Greeks from a data vendor are only reliable if the underlying reference data is accurate and standardized. Strikes, expiry dates, multipliers, and underlying mappings all have to be correct. A vendor can compute delta to many decimal places and it still means nothing if the contract identifier maps to the wrong instrument.

Why Empirical Volatility Matters

Empirical implied volatility is based on what actually traded in the market. It provides an accurate foundation for Greeks because it is grounded in realized market activity, not theoretical assumptions. Open interest adds positioning context that price data alone cannot provide. A spike in open interest around a specific strike tells you where convexity risk is concentrated in the market, which matters when you are sizing hedges and assessing crowding risk.

Symbol Master’s End-to-End Advantage

Symbol Master runs the entire pipeline: realized volatility calculations, historical 30-day volatility, empirical implied volatility from all reported strikes and prices, theoretical models for complete surfaces, and all Greeks derived from these inputs. Risk managers, traders, and portfolio managers get the complete volatility offering without the need for dedicated infrastructure or high-cost in-house resources. This eliminates the burden of competing assumptions about missing data points and interpolation methods that otherwise fall on data consumers.

Learn more about Symbol Master’s options reference data on our Services page.

Key Data Points Across Front, Middle, and Back Office Operations

Detail the specific data elements risk managers require:

The Volatility Surface: Empirical and Theoretical

The implied volatility surface is not just a pricing convenience. It is the lens through which scenario risk becomes quantifiable across the entire strike-maturity space. Empirical implied volatility varies by strike and expiration based on actual market data. Theoretical models create a complete surface even where strikes are not actively priced, enabling risk teams to price and hedge positions at any strike and tenor.

Traders need volatility surfaces for options strategies and position management. Risk managers need IV data across the entire surface for accurate portfolio VaR and stress testing. Portfolio managers need volatility views across single stocks, ETFs, equity indices, and universes up to 300+ names or S&P 500 constituents, with coverage of FLEX options for multi-year term structures. Skew and term-structure analysis depends on complete, accurate IV data.

Options Greeks / Sensitivities for Risk Management, Trading, and Portfolio Management

Delta: Measures directional exposure, how much option value changes per $1 move in the underlying. Risk managers aggregate portfolio delta to assess total market exposure. Delta is foundational to delta-hedging strategies and directional risk limits.

Gamma: Measures delta sensitivity, or how quickly directional exposure changes. A large gamma position means your delta hedge decays quickly as the underlying moves, requiring frequent rebalancing. For a long call with gamma of 0.04, a $2 move in the underlying changes delta by 0.08. Across a large book, that shifts compounds into significant realized P&L variance.

Vega: Measures volatility sensitivity, how much portfolio value changes with implied volatility shifts. For most options books, volatility risk management is the dominant challenge. Vega exposure drives the majority of P&L surprises. Vega is essential for volatility risk management and scenario analysis, particularly during market stress when volatility spikes.

Theta: Time decay impact on portfolio value. Expressed as the value the position loses as one calendar day passes. Theta helps risk managers project daily P&L attribution and understand carry and premium erosion.

Rho: Interest rate sensitivity. Less commonly monitored for short-dated options, rho becomes relevant for longer-dated portfolios and low-rate environments.

Symbol Master calculates and delivers all Greeks using its complete volatility pipeline across US stocks, ETFs, equity indices, and 24 international markets.

Symbol Master service platform CTA banner — explore institutional options data

Symbol Master’s Complete Options Data Pipeline

Position Symbol Master’s specific Analytics offering for all forms of risk management use cases

The Five Volatility Calculations

Symbol Master’s complete volatility pipeline delivers:

Realized Volatility
Single-day price movement calculations grounding risk decisions in current market behavior.

Historical Volatility
30-day movement expectations, establishing expectations over previous and forward time horizons.

Empirical Implied Volatility
Based on all actual market data, strikes, prices, open interest, term structure, without assumptions where data doesn’t exist.

Theoretical Implied Volatility: SSVI Model
Applied to US and FLEX options markets, where efficient market conditions produce optimal results across the full term structure. Efficient markets like the US standardized and FLEX universes allow for granular SSVI modeling. Based on the various global markets SMI has available price information, standardized calculations are variable based on “Close, Last, Settle” logic.

Theoretical Implied Volatility: SABR Model
Applied to global markets (EU, APAC, Far East) operating at various stages of development. SABR accounts for different market structures, including consolidated tape challenges and varying settlement conventions, ensuring accurate surfaces across diverse regional markets. Based on the various markets SMI has available price information, standardized calculations are variable based on “Close, Last, Settle” logic.

This complete volatility spectrum is unique to Symbol Master. It provides a model reference that eliminates the burden of competing business assumptions and interpolation for data consumers, unifying their needs without requiring dedicated infrastructure or high-cost in-house resources.

Global Options Coverage

Symbol Master provides comprehensive coverage of US equities, ETFs, and equity index options across the entire standardized listed options market. Beyond the US, Symbol Master extends to 24 additional countries, enabling multi-market risk managers to work from unified and consistent data methodology across multiple geographies. Standardized data formats and unified calculation methodologies ensure consistency globally.

SOD and EOD “Golden Copy” Data

Start of Day data provides validated reference data for trading, risk calculations, and position valuations at market open. End of Day data, with unified official closing price logic, delivers implied volatility and Greeks for effective position management and standardized regulatory reporting. Consistent timing and delivery ensures enterprise integration into institutional workflows, with data quality controls ensuring accuracy and completeness.

Conclusion

Options data and risk management rise or fall together. The ceiling of your risk infrastructure is set by the quality of your data inputs. Risk metrics, stress tests, hedge strategies, and regulatory filings are all downstream of the data that feeds them.

Implied volatility is the linchpin, it drives option pricing, Greeks calculations, and vega hedging strategies. Symbol Master’s complete volatility pipeline delivers realized, historical, empirical implied volatility, and theoretical implied volatility (SABR and SSVI), providing the foundation institutional traders, risk managers, and portfolio managers need for validated risk decisions across the US and 24 global markets.

Need a complete volatility and Greeks pipeline for institutional options workflows? Explore Symbol Master’s comprehensive options reference data offerings at symbolmaster.com/service.

How to Analyze Options: A Practical Guide for Financial Professionals

Analyzing options contracts requires detailed understanding of multiple data points and metrics simultaneously, options do not behave like stocks or bonds and their value depends on multiple variables such as price, time, volatility or rates simultaneously.

Whether you are evaluating a single contract or screening hundreds of opportunities, systematic analysis separates profitable organization and users from costly mistakes.

Effective options analysis rests on three core pillars: understanding the underlying asset, evaluating contract-specific metrics such as implied volatility, Greeks, series data, open interest, and deliverables, and assessing broader market and portfolio conditions. This guide outlines the essential components of options data analysis, explains how to interpret critical metrics, and shows how high-quality data feeds, like those provided by Symbol Master, enable more accurate, scalable, and defensible decision-making.

Understanding the Foundation: Essential Options Data

Before any analysis on specific contracts can begin, financial professionals need access to complete, accurate, and standardized options market data. Even the most sophisticated models or risk frameworks will produce misleading results. Whether you are assessing individual contracts or aggregating exposures across portfolios, the integrity of your inputs determines the quality of your outputs.

Symbol Master coverage CTA banner — view full options data coverage across 21 countries

Core Data Requirements

Option analysis that is sturdy starts with a comprehensive dataset that captures the complete optionable equity universe in the market. This includes options series information, all available strikes, expiration date, and contract specifications, this allows analysts to properly map the opportunity set. End of Day (EOD) and Start of Day (SOD) Reference and Pricing data is equally important, including bid/ask spreads, last trade, volume, open interest corporate action, unadjusted and adjusted values.

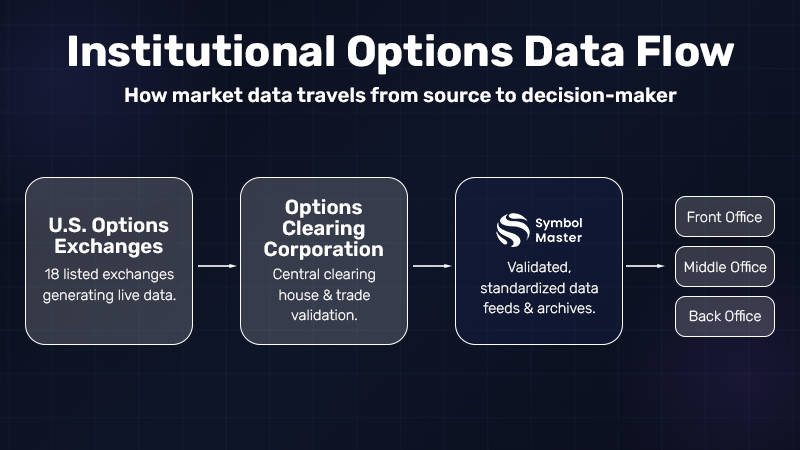
Every listed strike level, open interest across all tradable options on 18 exchanges (cleared through the Options Clearing Corporation) provides visibility into positioning and liquidity. Historical archives of all files ensure data integrity, back testing strategies and pricing models, risk management, and pattern analysis. Without this comprehensiveness and harmony, incomplete or inaccurate data leads to flawed analysis, and poor data quality that ultimately impact all firm decisions.

The Role of Reliable Data Feeds

Professional users depend on validated and standardized data feeds to ensure consistency across front, middle, and back office workflows. This is where providers like Symbol Master play a critical role.

By maintaining comprehensive options series coverage across all exchanges, Symbol Master ensures complete visibility into the tradable universe. Its extensive historical archives, support rigorous backtesting, model validation, and pattern recognition across market cycles.

For a deeper look at coverage and capabilities, explore the Symbol Master service offering, which highlights options series master data and full market data coverage essential for institutional-grade options analysis.

Analyzing Contract-Specific Metrics

Once a solid data foundation is in place, the next step in options analysis is evaluating the contract-specific metrics that define each option’s behavior. These metrics capture how a contract responds to changes in price, time, volatility, and broader market conditions, making them essential for risk assessment, valuation, and portfolio construction.

Implied Volatility Analysis

Implied volatility is a forward-looking measure of market expectations and a primary input into option pricing. From our perspective, effective options data analysis requires comparing implied volatility with realized and historical measures to contextualize pricing across time and market regimes. This comparison helps determine whether options are relatively overvalued or undervalued.

Symbol Master delivers comprehensive coverage across implied, realized, and historical volatility datasets, enabling users to perform consistent cross-sectional and time-series analysis. This is particularly critical around earnings announcements and global macro events, where volatility expectations, and therefore option prices, can shift rapidly.

The Greeks: Measuring Risk and Sensitivity

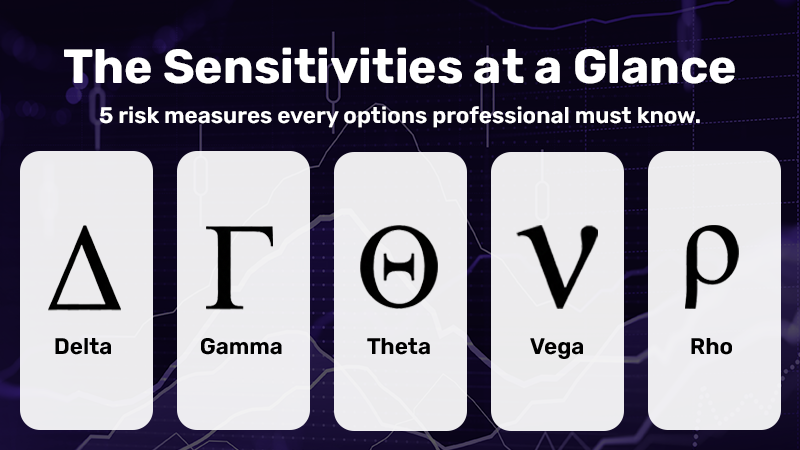
Implied Volatility and Greek Sensitivities form the backbone to accurate options analysis. Delta measures how an option’s price responds to a $1 move in the underlying asset, indicating directional exposure. Gamma tracks how quickly that exposure changes, making it essential for managing hedging adjustments. Theta captures time decay, quantifying the daily erosion in option value, while Vega reflects sensitivity to volatility, often the dominant risk factor during earnings cycles or market stress. Rho, though typically less impactful for short-dated contracts, measures sensitivity to interest rate changes.

Infographic showing the 5 options Greeks — Delta, Gamma, Theta, Vega, and Rho — and their role in options risk analysis

At Symbol Master, we process and validate implied volatility and Greeks through a curated mathematical pipeline designed for precision and consistency. These analytics empower front, middle, and back office users to perform accurate risk assessment and portfolio position sizing, supported by data that meets institutional standards.

Historical Indicators

Historical EOD and SOD datasets provide the context needed to interpret current market conditions. At Symbol Master, we emphasize the importance of long-term, high-quality historical archives to uncover patterns in pricing, liquidity, and volatility behavior.

Key indicators such as volume and open interest offer insight into market participation and liquidity. Higher levels typically signal more efficient price discovery and more reliable execution conditions. By delivering clean, standardized historical data, we enable professionals to identify trends, validate models, and make more informed decisions across the full lifecycle of options analysis.

Evaluating Market Context

At Symbol Master, we emphasize that options cannot be analyzed in isolation. Broader market conditions, price trends, sentiment, and volatility structure, directly influence how contracts are priced and how risk evolves. Incorporating market context into your workflow ensures that contract-level analysis is grounded in real-world conditions rather than abstract assumptions.

Analysis of the Underlying and Optionable Asset

A disciplined approach begins with the underlying asset. Identifying trend direction using tools such as moving averages, as well as key support and resistance levels, provides the directional framework for analysis. Options positioning should align with this bias—calls in bullish conditions, puts in bearish environments, and spreads when markets are neutral or range-bound.

Beyond direction, detailed data attributes, including strike availability, expiration cycles, and contract specifications, play a critical role in selecting appropriate strike prices. Accurate series data ensures that professionals can map exposures precisely and avoid misalignment between strategy and market conditions.

Market Sentiment Indicators

Market sentiment adds another layer of insight. Put/Call ratios help gauge overall positioning and can indicate whether markets are skewed toward bullish or bearish expectations. Unusual options activity, such as large or atypical trades, may signal informed positioning or institutional flows.

Equally important is understanding the volatility surface and term structure, which reveal how implied volatility varies across strikes and maturities. These dynamics provide critical insight into pricing inefficiencies and sentiment shifts, influencing both valuation and risk assessment across the entire options landscape.

Building Your Analysis Workflow

A consistent, data-driven workflow is essential for scalable and defensible options data analysis. At Symbol Master, we advocate for a structured approach built on high-quality, validated data inputs to ensure analytical integrity across all stages of evaluation.

Step-by-Step Analysis Framework

  1. Define your market outlook and time horizon for the underlying asset
  2. Screen for relevant contracts based on expiration cycles and strike criteria
  3. Evaluate realized, historical, and implied volatility, both empirical and theoretical, alongside Greek sensitivities to quantify risk exposure
  4. Compare volatility measures relative to current levels to assess pricing context
  5. Review historical metrics, including SOD/EOD data, valuations, volume, and open interest, to validate liquidity and behavioral patterns

Tools and Data Requirements

Effective options analytics depend on precise, comprehensive, and curated data. Symbol Master provides the foundational datasets required for institutional workflows, including complete series information, realized, historical, and implied volatility along with Greek sensitivity measures, and term structure with expiration schedules.

Our validated data feeds integrate seamlessly into a firm’s security master and enterprise platforms, enabling consistent data quality across internal risk, analytics, and trading systems. For a detailed view of data breadth and delivery options, including SFTP and API access,
contact Symbol Master.

Conclusion

Successful options analysis workflows depend on combining high-quality data with a structured analytical framework. From understanding contract-specific metrics, such as series data, implied volatility, Greek Sensitivities, and liquidity; to evaluating broader market context and applying systematic processes, each component plays a critical role in informed decision-making.

Reliable data is the foundation of this process. Symbol Master’s comprehensive options data offerings and historical archives, provide our consumers with accurate and consistent building blocks that financial professionals require.

Ready to access unified institutional-quality options data for your analysis?
Explore Symbol Master and discover how our data can power your workflow.

Symbol Master service platform CTA banner — explore institutional options data